The Taiwanese Economy in June 2020
The world demand has recovered somewhat as the United States and
European economies have started to reopen and restart their economic
activities after weeks of lockdown; however, uncertainties betide
due to increasing confirmed infected cases. Despite of remaining
uncertainties, the recovery of global demand for the time being
has indeed helped pick up all three composite indicators issued
by the Taiwan Institute of Economic Research (TIER) once again.
The manufacturing, service and construction composite indicators
all went up in June.
Taiwan's exports in June 2020 decreased by 3.83% compared with the
same month of 2019 in spite of a strong market demand for ICT parts
and components with respect to higher base effect. Regarding imports,
Taiwan's imports in June 2020 decreased by 8.59% compared with imports
in June of 2019 due to the continuously dipping prices of raw materials.
On the cumulative basis, Taiwan's exports and imports from January
1st till June 3oth of 2020 grew by 0.52% and -0.37% compared with
the same period of previous year. The trade surplus during the period
stood at US$ 21.35 billion or increased by 6.59% on the year-on-year
basis.
Taiwan's consumer price index (CPI) decreased by 0.76% in June 2020
compared with the same month of previous year due to the still decreasing
global crude oil and commodity prices. The core inflation rate excluding
prices of the energy and food increased by 0.13% in June 2020. In
addition, the wholesale price index (WPI) decreased by 10.36% in
June 2020 on the year-on-year basis due to the fact that commodity
prices dropped continuously. On the cumulative and year-on-year
basis, Taiwan's CPI and WPI from January 1st till June 30th of 2020
drop by 0.22% and 8.20% respectively.
As for exchange rate, the NTD went somewhat stronger due to the
relatively weaker USD. The NTD/USD stood at 29.66 in late June 2020
indicating a 1.24% appreciation. Regarding the interest rate, it
remained low and steady in June 2020 due to the continued loose
monetary operations by the CBC with respect to the most recent CPI
reading; the lowest and highest over-night call rate in June 2020
stood at 0.078% and 0.101% respectively.
Business Outlook
The portion of manufacturing firms who perceived business were
better than expected in the target month was 27.7% or increased
by 1.4 percentage points compared with respondents who perceiving
better business in the previous month. The portion of those perceived
business were getting worse in the target month was 31.2% or decreased
by 6.1 percentage points than 37.3% perceiving worse business of
the previous month. The portion of manufacturing firms who perceived
business remained constant in the target month was 40.2% or increased
by 3.8 percentage points compared with 36.4% perceiving constant
business in the previous month. Overall, manufacturing firms perceived
the business in the target month was somewhat optimistic than the
previous month.
In addition, the portion of manufacturers who perceived business
would be better in the next six months was 21.3% in the target month
or decreased by 16.0 percentage points than 37.3% feeling more optimistic
about the future in the previous month. The portion of firms who
perceived the economic outlook would be worsening was 26.6% or increased
by 4.6 percentage points compared with 22.0% feeling rather pessimistic
about the future in the previous month. The portion of manufacturing
firms who perceived business remained constant in the next six months
stood at 51.3% or increased by 10.6 percentage points compared with
40.7% feeling neutral about the business outlook one month earlier.
Overall, manufacturing firms perceived the business in the near
future was less optimistic and more neutral compared with the previous
month.
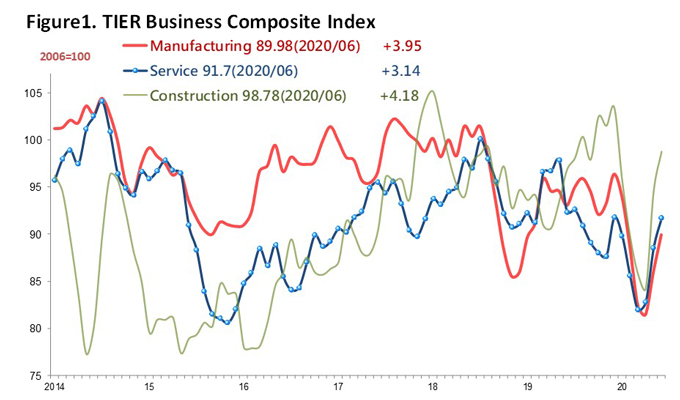
The manufacturing composite indicator for June 2020 adjusted for
seasonal factors on moving average, saw an upward correction, and
from a revision of as 86.03 points in May 2020 moved up to 89.98
points. Figure 1 shows an increase of 3.95 points, the second month
of consecutive increase.
The TIER service sector composite indicator for June 2020 adjusted
for seasonal factors on moving average also saw an upward correlation,
and from a revision of as 88.56 points in May 2020 moved up to 91.70
points. Figure 1 shows an increase of 3.14 points, the third month
of consecutive increase.
In addition, the TIER Construction Sector Composite Indicator for
the seasonal factors on moving average saw an upward correlation
as well, and from a revision of 94.60 points in May 2020 went up
to 98.78 points. Figure 1 shows an increase of 4.18 points, the
second month of consecutive increase.
Forecast on Individual Industries
Following are manufacturers' sentiments that are industry-specific
in the monthly TIER surveys:
● Manufacturers' sentiments that have been in decline in the June
survey and are expected to deteriorate over the next six months
include:
Yarn Spinning Mills, Fabric Mills, Man-made Fibers Manufacturing,
Screw, Nut Manufacturing, Machinery and Equipment Manufacturing
and Repairing, Cutlery and Tools Manufacturing, Industrial Machinery.
● Manufacturers' sentiments that have been in decline in the June
survey, but are expected to improve over the next six months include:
None.
● Manufacturers' sentiments that have been in decline in the June
survey and are expected to remain sluggish over the next six months
include:
Iron and Steel Basic Industries, Fabricated Metal Products Manufacturing,
Banks, Insurance.
● Manufacturers surveyed who felt the June outlook was the same
as the previous month, but the outlook is expected to exacerbate
over the next six months include:
Textiles Mills, Glass and Glass Products Manufacturing.
● Manufacturers surveyed who felt the June outlook was the same
as the previous month, but the outlook is expected to improve over
the next six months include:
Apparel, Clothing Accessories and Other Textile Product Manufacturing,
Non-metallic Mineral Products Manufacturing, Cement and Cement Products
Manufacturing, Electrical Machinery, Electrical Machinery, Supplies
Manufacturing and Repairing, Electric Wires and Cables Manufacturing,
Audio and Video Electronic Products Manufacturing, Retail Sales.
● Manufacturers surveyed who felt the June outlook was the same
as the previous month and the trend is expected to continue for
the next six months include:
Manufacturing, Food, Slaughtering, Frozen Food Manufacturing, Wood
and Bamboo Products Manufacturing, Metal Dies, Metal Structure and
Architectural Components Manufacturing, Electronic Machinery, Communications
Equipment and Apparatus Manufacturing, Data Storage Media Units
Manufacturing and Reproducing, Motorcycles Manufacturing, Precision
Instruments Manufacturing, Education and Entertainment Articles
Manufacturing, Telecommunication Services, Transportation and Storage.
● Manufacturers' sentiments that have improved in the June survey
and is expected to deteriorate over the next six months include:
Leather, Fur and Allied Product Manufacturing, Industrial Chemicals,
Petrochemicals Manufacturing, Petroleum and Coal Products Manufacturing,
Rubber Products Manufacturing, Restaurants and Hotels.
● Manufacturers' sentiments that have improved in the June survey
and is expected to remain upbeat over the next six months include:
Soft Drink Manufacturing, Paper Manufacturing, Printing, Electrical
Appliances and Housewares Manufacturing, Bicycles Manufacturing,
Bicycles Parts Manufacturing, Construction, Basic Civil Structure
Construction, Real Estate Investment, Securities.
● Manufacturers' sentiments that have improved in the June survey
and the trend is expected to continue for the next six months include:
Edible Oil Manufacturing, Flour Milling and Grain Husking, Prepared
Animal Feeds Manufacturing, Plastics and Rubber Raw Materials, Chemical
Products Manufacturing, Plastic Products Manufacturing, Porcelain
and Ceramic Products Manufacturing, Electronic Parts and Components
Manufacturing, Transport Equipment Manufacturing and Repairing,
Motor Vehicles Manufacturing, Motor Parts Manufacturing, Motorcycles
Parts Manufacturing, Wholesale.
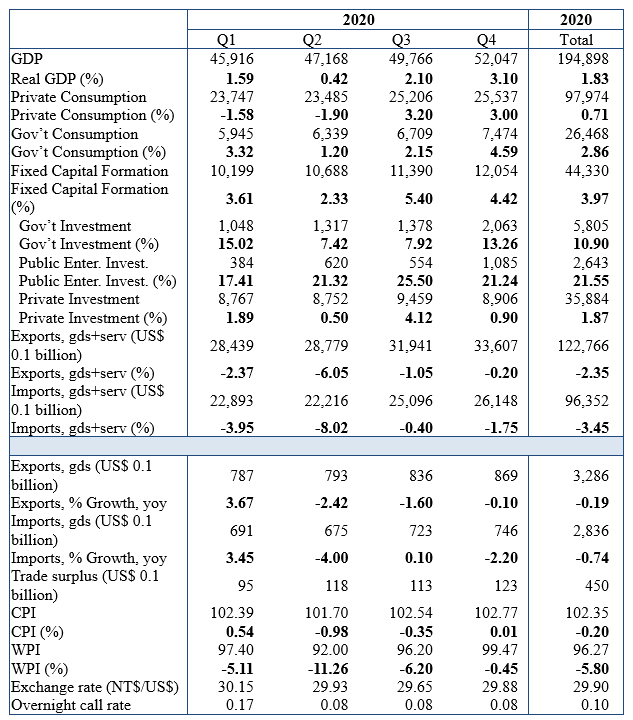
TIER Forecast (issued on 24th July,
2020.)
(NT$100 million, Chained (2016) Dollars)
|